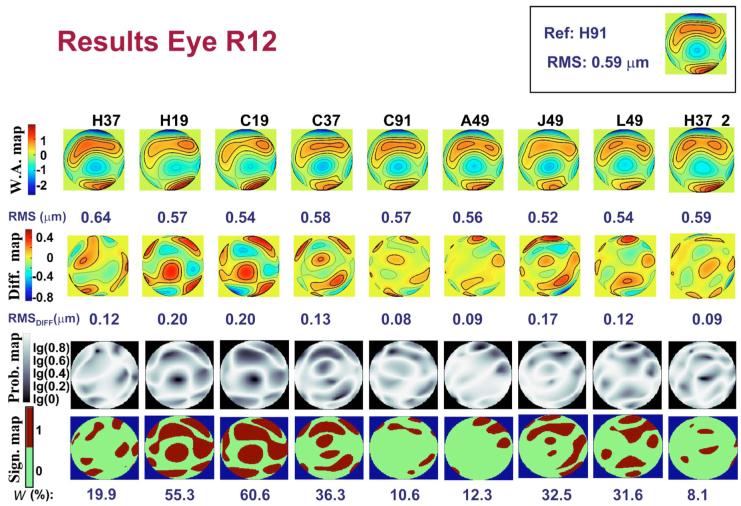
Fig. 4.
(Color online) Results obtained for the human eye R12, using the different sampling patterns. First row, wave aberration maps for third- and higher-order aberrations. Second row, corresponding difference maps (after subtracting the reference). Contour lines are plotted every 0.3 and 0.15 μm for the wave aberration maps and the difference maps, respectively. Thicker contour lines indicate positive values. RMSs for wave aberration and difference maps are indicated below each map. Third row, probability maps representing the probability values obtained, point by point, when comparing the wavefront height values obtained using the reference pattern and those corresponding to the assessed pattern. Fourth row, regions of the pupil where the significance values were above 0.05 (significantly different areas). The number below each map indicates the corresponding value of the metric W%; i.e., the percentage of the pupil that is significantly different between the pattern and the reference. The reference wave aberration map and its corresponding RMS are located in the top right-hand corner.

