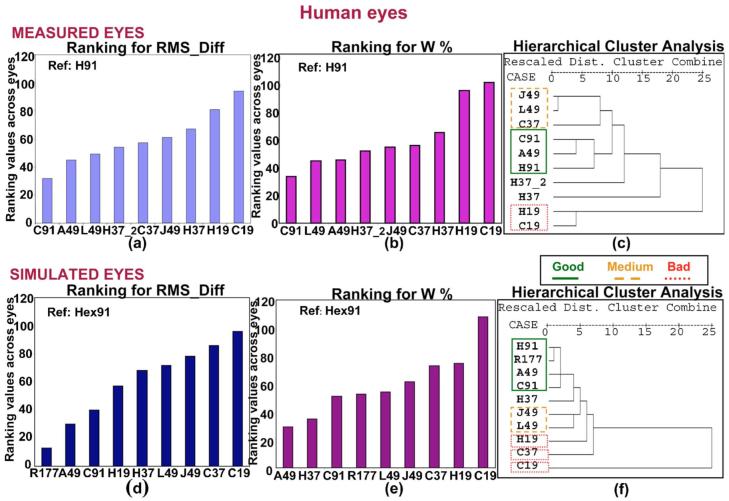
Fig. 5.
(Color online) (a), (d) Ranking values for RMS_Diff corresponding to each sampling pattern across the measured and simulated human eyes, respectively. (b), (e) Ranking values for W% corresponding to each sampling pattern across the measured and simulated human eyes, respectively. (c), (f) Dendrogram corresponding to the hierarchical cluster analysis for the measured and simulated human eyes, respectively. Solid, dashed, and dotted lines indicate “good,” “medium,” and “bad” clusters, respectively, according to the classification obtained from the metrics. “Dist.” stands for “distance.”

