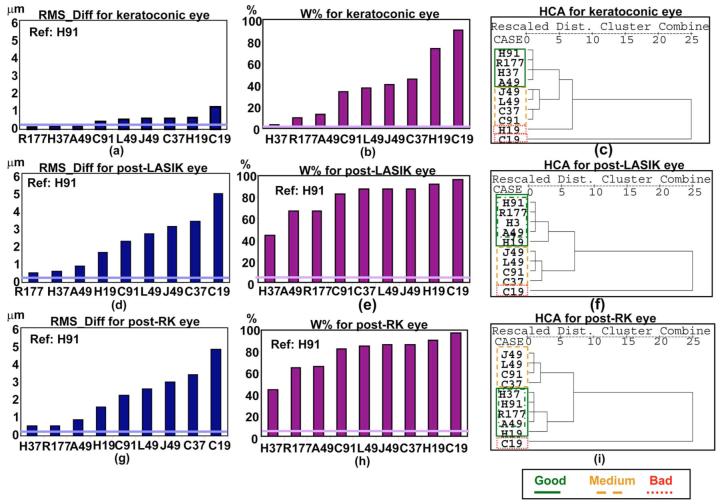
Fig. 7.
(Color online) Results obtained for the keratoconic [first row: (a), (b), (c)], post-LASIK [second row: (d), (e), (f)], and post-RK [third row: (g), (h), (i)] eyes. The first [(a), (d), (g)] and second columns [(b), (e), (h)] show the results for the metrics RMS_Diff and W%, respectively, corresponding to each pattern. The thicker horizontal line represents the threshold corresponding to each eye for the corresponding metric. Values of the metric below this threshold indicate that the differences are due to variability in the measurement and not to differences between patterns. The third column [(c), (f), (i)] shows the dendrograms corresponding to the hierarchical cluster analysis (HCA) for the keratoconic, post-LASIK, and post-RK eyes. “Dist.” stands for “distance.” The less distance between patterns, the more similarity between them. Solid, dashed, and dotted lines indicate “good,” “medium,” and “bad” clusters, respectively, according to the classification obtained from the metrics.

