Figure 6.

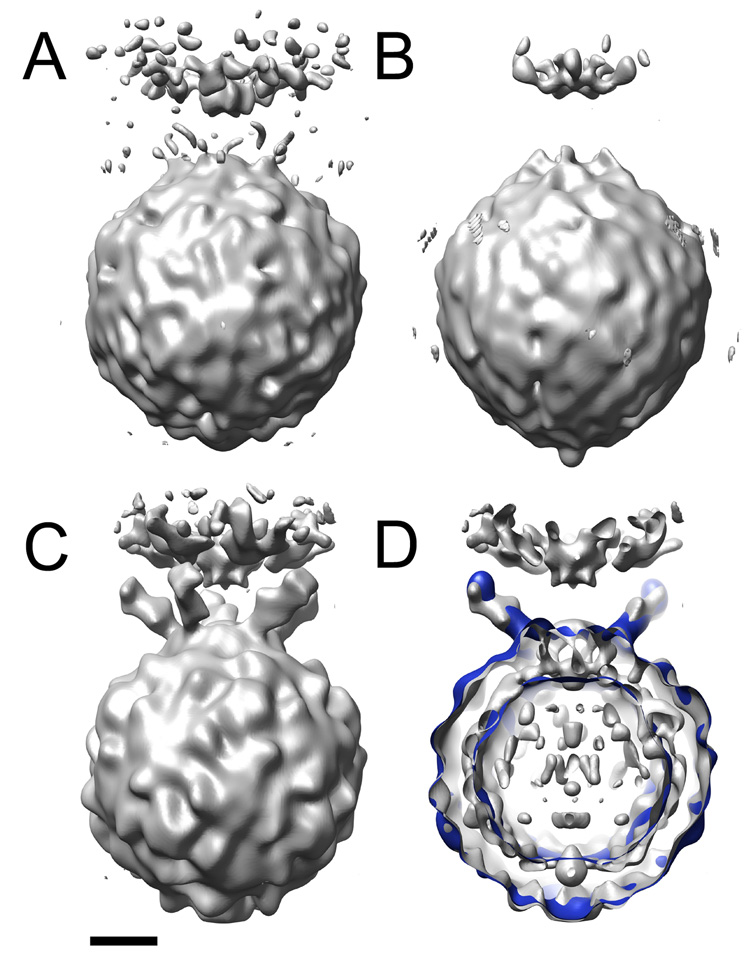
3D reconstructions of the poliovirus-receptor-liposome complex. Optimized 2D and 3D spot intensities were used to derive Eulerian angles for dotted images. These orientations were applied to undotted images to calculate an initial model of the virus-receptor-liposome complex (A). (B) is the original preliminary model, before intensity optimization. (C) and (D) show the final reconstruction from Bubeck et al., 2005 (grey). (D) is a slabbed view the final reconstruction (grey) overlaid with model-based electron density calculated from pseudo atomic models fitted by Belnap et al. (2000b) (blue). Similar to the final reconstruction (C), the preliminary model resulting from optimized intensities (A) contains strong density for the membrane, including the perturbation that protrudes towards the viral 5fold. In addition, its viral features are similar those found in the final reconstruction. In contrast, the virus in the unoptimized reconstruction (B) appears less well defined and is distorted along the 5fold. Scale bar, 75 Å.
