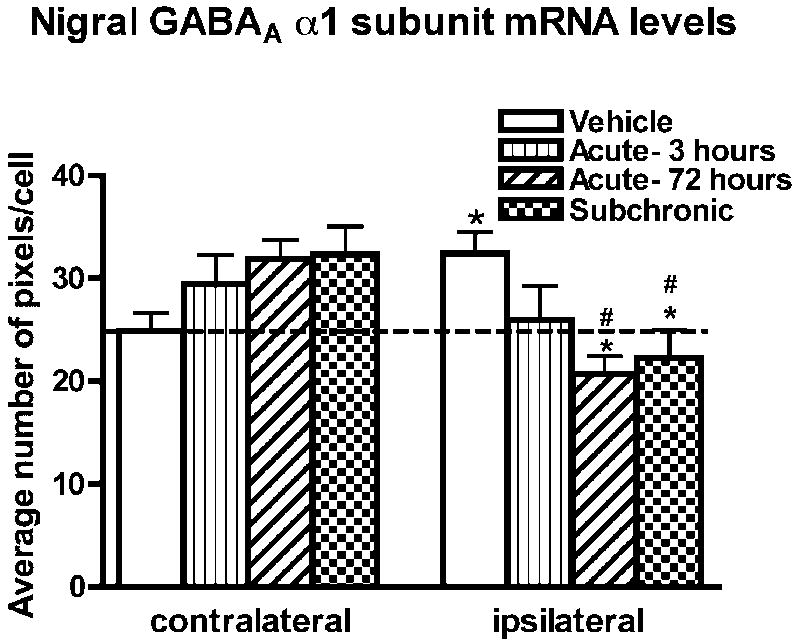
Figure 8.
Quantification of GABAA receptor α1 subunit mRNA levels was carried out at the single cell level by computerized image analysis on emulsion radioautographs in the contralateral and ipsilateral SNr of rats injected with vehicle or SKF-81297 (acute-3 hours, acute-72 hours, or subchronic). The data were obtained from two slides per animal with n=5 animals per condition and are the mean±S.E.M. expressed as an average number of pixels per neuron. *p<0.05 compared with respective contralateral side to 6-OHDA-lesion (paired t-test). Differences between groups are analyzed with a one-way ANOVA followed by a Bonferroni post hoc test. #p<0.05 compared to vehicle.

