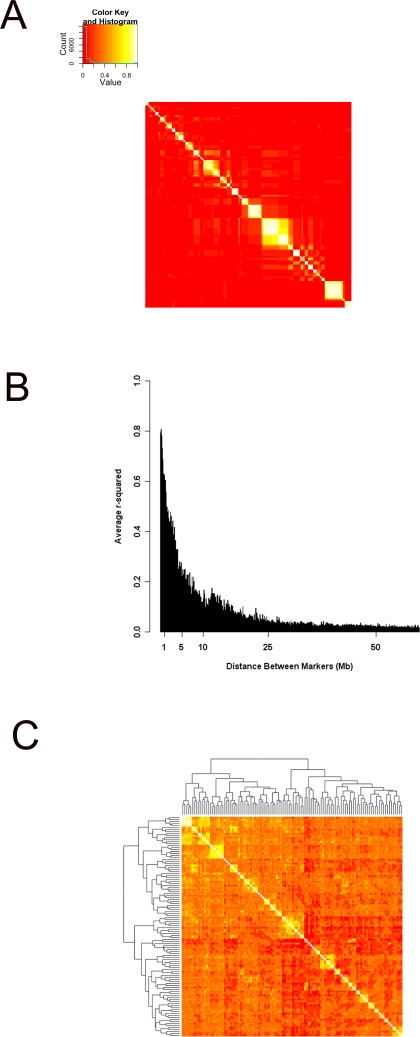
Figure 1. LD and population structure in the MF1 population.
Panel (A) shows the LD structure on chromosome 1. The order of markers in the heat map follows the physical location of the marker along the chromosome with the most proximal starting at the bottom and on the right and the most distal marker on the top and on the left. The correspondence between color and r2 is shown in the insert. Panel (B) shows the distribution of r2 values between markers located at various distance from each other. Each bar depicts a 100 kb bin for the distance between marker pairs. The average r2 for marker pairs within 2Mb of each other is 0.58, for markers between 2 to 5 Mb is 0.3, and for markers 5Mb or more away from each other is 0.05. Panel (C) shows the heatmap visualization of genetic similarity between individual mice. The dendograms on the top and on the side of the heat map are based on the hierarchical clustering of genome wide genotype similarity of the 110 MF1 mice.

