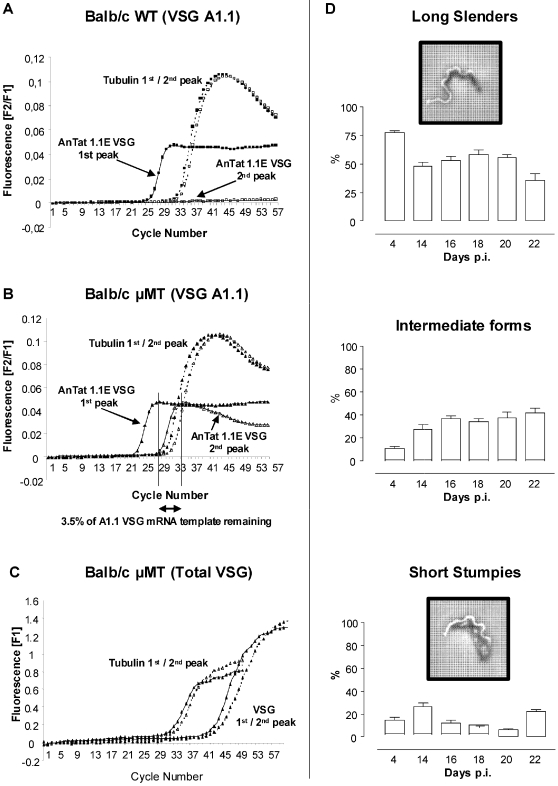
Figure 5. Quantitative analysis of VSG switching.
Switching of VSG expression was followed by real time RT-PCR, by amplification of peak stage parasite RNA with primers specific for VSG AnTat 1.1E and the housekeeping genes tubulin-zeta (Tubulin). (A) RNA was isolated from WT derived and (B) µMT derived parasites on the first and second peak, respectively occurring on day 6 and 14. Expression of VSG AnTat 1.1E specific RNA on the second peak was calculated and compared to the first peak, after normalization of the first and second peak VSG AnTat 1.1E specific RNA to tubulin-zeta gene expression.. One representative of two experiments are shown. (C) Similarly, total VSG mRNA was amplified from first and second peak µMT derived parasites, using VSG-Uni primers, and results were normalized using Tubulin gene expression. (D) To assess parasite proliferation in µMT mice, the occurrence of dividing ‘long slender’ parasites versus intermediate and non-dividing ‘short stumpy’ parasites was analyzed by light microscopy on day 4 and compared to the chronic infection stage (up to day 22).

