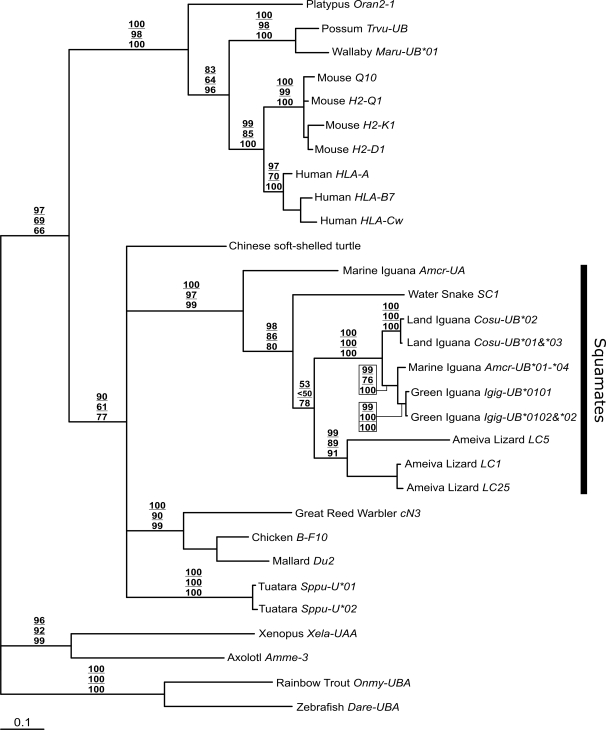
Figure 4. Class I phylogenetic reconstruction using α-3 (exon 4) sequence data from the major vertebrate groups.
The top number at each node is the Bayesian posterior distribution value supporting the topology displayed. The middle and bottom numbers are bootstrap values from maximum likelihood and neighbor joining searches respectively. Branch lengths are represented as expected number of substitutions per site and were inferred along with topology in the Bayesian analysis.

