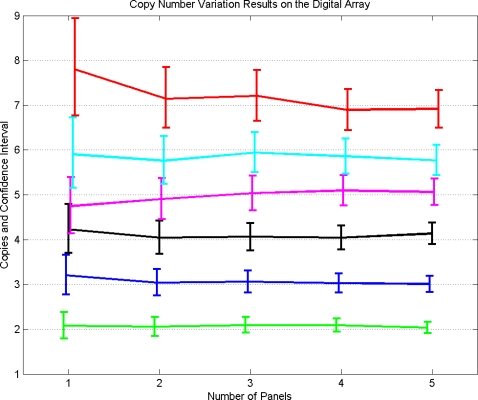
Figure 8. Results of actual CNV experiments on the digital array with varying number of copies of the target gene.
In total, 6 different known ratios were estimated by running the experiments for varying number of panels. The graphs for different numbers of copies are slightly staggered to allow visual comparison of overlap of the 95% confidence intervals.

