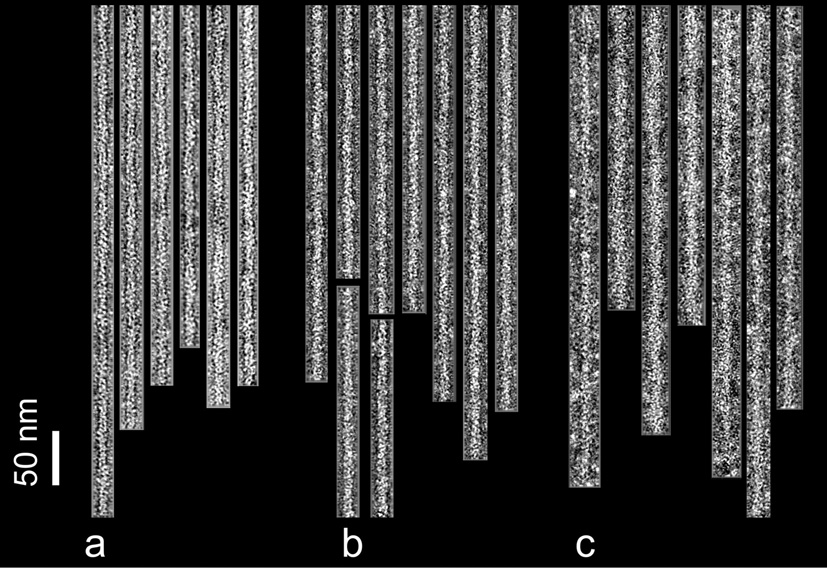
Fig. 1.
Electron micrographs of negatively stained filaments. F-actin control filaments (a), F-actin decorated with cTerm-TnI (b), F-actin-tropomyosin decorated with cTerm-TnI (c). Note the increase in diameter due to the TnI label, particularly in (c). Filaments are shown with their pointed ends facing up; polarity was determined by alignment tools in reference 22. Scale bar = 50 nm.
Preparation and assay of proteins: F-actin, cardiac troponin and tropomyosin were purified as previously20. cTerm-TnI was expressed and purified as follows: The cDNA for human cardiac TnI residues 131–210 was inserted into pET3d, transformed into Rosetta pLysS cells, and a single colony used to seed 1L of Overnight Express Media (CalBiochem/Novagen). Cells were lysed with sonication in 20mM Tris buffer (pH 8.0), 20% sucrose, 1mM EDTA, 5µg/ml TPCK, 5µg/ml TLCK and 0.3mM PMSF. The pellet fraction was resuspended and sonicated in 10mM MOPS buffer (pH 7.0), 5M urea, 1mM dithiothreitol, 5µg/ml each of TPCK and TLCK, 0.01% NaN3 and 0.3mM PMSF. The supernatant fraction was dialyzed against 10mM MOPS (pH 7. 0), 2mM dithiothreitol, 5µg/ml TPCK and TLCK, 0.01% NaN3 and 0.3mM PMSF, and purified by successive SP Sepharose and AKTA system-Resource S columns. Protein concentration was determined by quantitative amino acid analysis, and identify confirmed by MALDI-MS. Actin-activated S1 MgATPase rates were measured at 25 °C20 in the presence of 10mM MOPS (pH 7), 1mM dithiothreitol, 4mM MgCl2, 5mM KCl, 1.0mM ATP, 1mM phosphoenolpyruvate, 3mg/ml pyruvate kinase, 0.2 mg/ml lactate dehydrogenase, and the rate of NADH (0.3mM) oxidation monitored spectrophotometrically for 5 minutes.
EM and image processing: Filaments were prepared by mixing a two-fold molar excess of cTerm-TnI (40 µM) with F-actin or F-actin-tropomyosin (20 µM) to optimize binding in 100mM NaCl, 3mM MgCl2, 1mM NaN3, 0.2mM EGTA, 1mM dithiothreitol, 5mM sodium phosphate/5mM Pipes buffer (pH 7.0) at 25°C21. The mixture was diluted 20-fold, applied to carbon-coated grids and stained with 1% uranyl acetate21. EM was done on a Philips CM120 EM at a magnification of X45,000 under low dose conditions (~12 e−/Å). Helical reconstruction22 and single particle reconstruction23 were performed by standard methods as previously21. Both methods revealed comparable cTerm-TnI density. The significance of the densities contributing to cTerm-TnI, was evaluated by using a Student’s t-test24,25.

