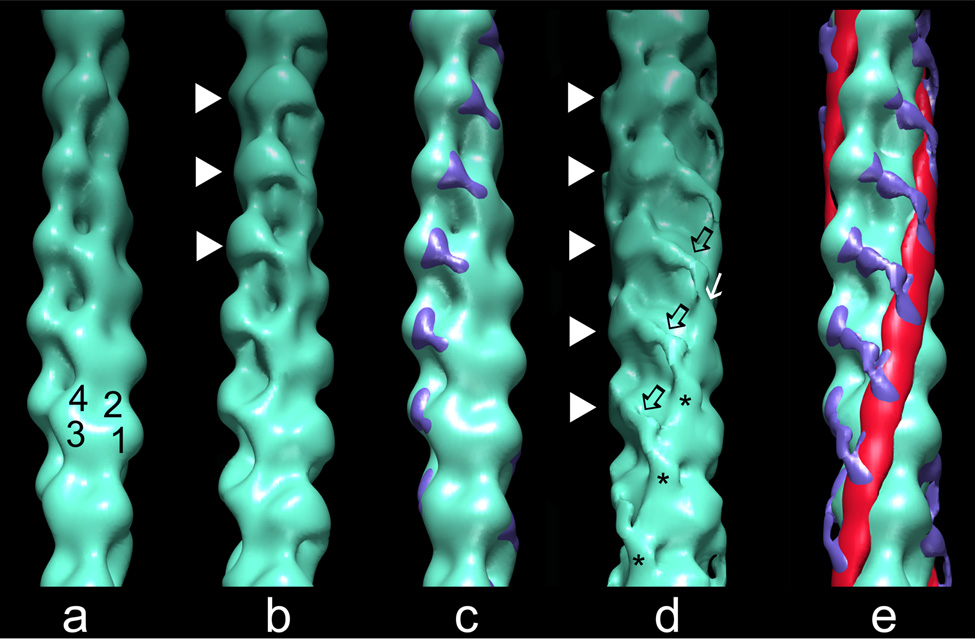
Fig. 2.
Surface views of thin filament reconstructions showing the position of cTerm-TnI on F-actin and F-actin-tropomyosin. Reconstructions of: (a) F-actin (subdomains noted). (b) F-actin decorated with cTerm-TnI; note density (white arrowheads) bridging between azimuthally neighboring actin subunits from subdomain 1 of one actin to subdomain 4 of the other. (c) Difference densities (blue), derived by subtracting F-actin from cTerm-TnI decorated F-actin, then shown superimposed on F-actin. (d) F-actin-tropomyosin decorated with cTerm-TnI; the TnI density is again seen bridging between azimuthally neighboring actin monomers (arrowheads), but the extra density here is more elongated and traverses obliquely over the lower actin (black open arrows). The TnI density ends as a finger-like mass (asterisk) on a clenched-hand that approaches and drapes over tropomyosin (white arrow). (e) Difference densities (blue for TnI and red for tropomyosin) between cTerm-TnI decorated F-actin-tropomyosin and F-actin, shown superimposed on F-actin. All of the reconstructions of thin filaments obtained were aligned to each other and are shown with filament pointed ends facing up.

