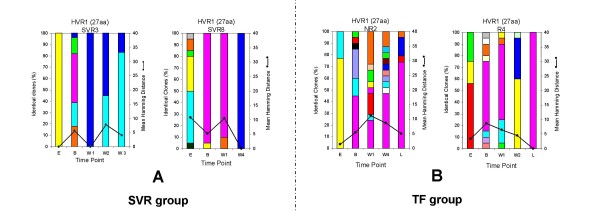
Figure 2.
Evolution of QC and QD within the 27 aa of the HVR1 in both group of patients. (A) 2 representative individuals within the SVR group, SVR3 and SVR8. (B) 2 representative individuals within the TF group, 1 non-responder (NR2) and 1 relapser (R4). The vertical bars indicate the number and the proportion of viral variants within each sample. Within the vertical bars, each variant is represented by a different colour. The dominant viral strain found in each patient at Baseline is in pink colour. The other strains are represented by different colours. The same colour indicates identity between viral strain present at different time point but not between different patients. The black line indicates the quasispecies diversity calculated by the mean Hamming distance (HD) from each sample.

