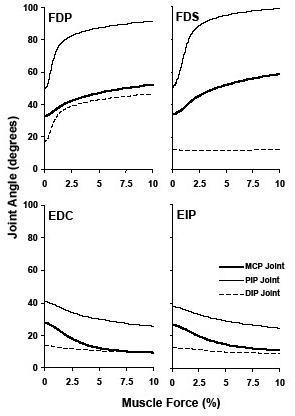
Figure 4.

Angular trajectories generated by the individual extrinsic muscles. The muscle forces are expressed as the percentages of their maximum force potentials. The force-angle curves were averaged across the 10 specimens.

Angular trajectories generated by the individual extrinsic muscles. The muscle forces are expressed as the percentages of their maximum force potentials. The force-angle curves were averaged across the 10 specimens.