
Figure 2.
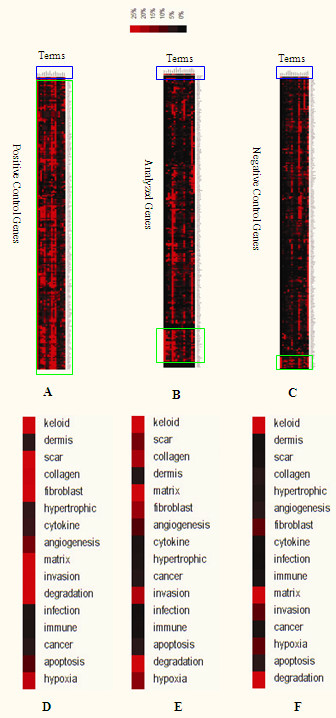
Literature profiling for three groups of genes. The clustergram generated for the analysis of patterns of keyword occurrence for the positive control genes (A), the analyzed genes (B), and the negative control genes (C), where blue boxed regions indicate the top bar, and green boxed regions indicate the keloid-related genes. (D-F) Magnification of the blue boxed regions in A, B, and C, respectively, for the positive control genes (D), the analyzed genes (E), and the negative control genes (F), which show the degree of association between keywords and genes.