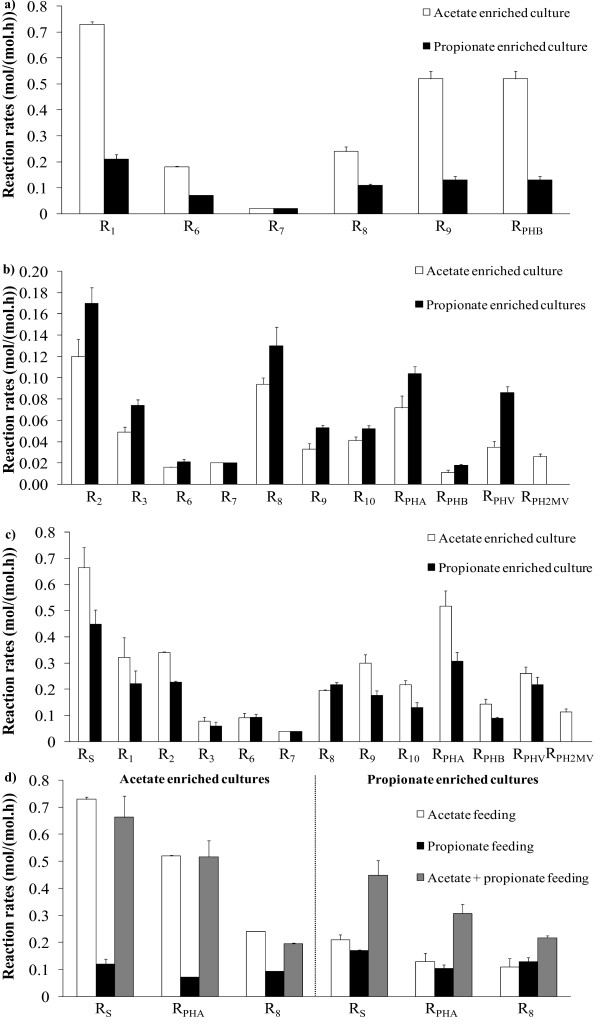
Figure 8.
MFD results. Figure shows MFD results for acetate (a), propionate (b) and acetate + propionate (c) feeding using acetate (■) and propionate (□) enriched cultures. Figure 8d presents MFD results of the main substrates uptake, PHA and oxidative phosphorylation fluxes for the two enriched cultures.

