Figure 3.
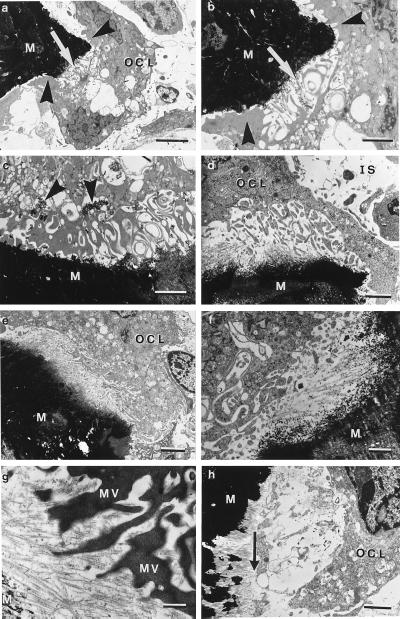
Ultrastructural changes in cathepsin-K-deficient tibial osteoclasts. (a and b) Control osteoclasts (OCL). At the resorption site (arrows), these cells protrude long microplicae comprising the characteristic ruffled border. The so-called “clear” zones are indicated by arrowheads. (c) Ruffled border of a control osteoclast depicting electron-dense inclusions (arrowheads). (d) Ruffled border of a cathepsin-K-deficient osteoblast, composed of numerous slender microplicae. Note the poorly defined resorption front. IS, interstitial tissue space; M, mineralized bone matrix. (e) Resorption interface between a cathepsin-K-deficient osteoclast and the mineralized bone matrix (M). Numerous fine collagen fibrils have been exposed by mineral removal by the osteoclast. (f and g) Resorption pits associated with cathepsin-K-deficient osteoclasts illustrating (at higher magnifications) the collagen fibrils that persist after digestion of the mineral substance (M). MV [in (g)], microvilli of osteoclast. (h) Well orientated and clearly exposed collagen fibrils in resorption pit associated with cathepsin-K-deficient osteoclast that are digested away at a straight resorption front (arrow). [Bars = 5 μm (a), 2 μm (b, c, d, h), 3 μm (e), 1 mm (f), and 0.5 μm (g).]

