
Figure 6.
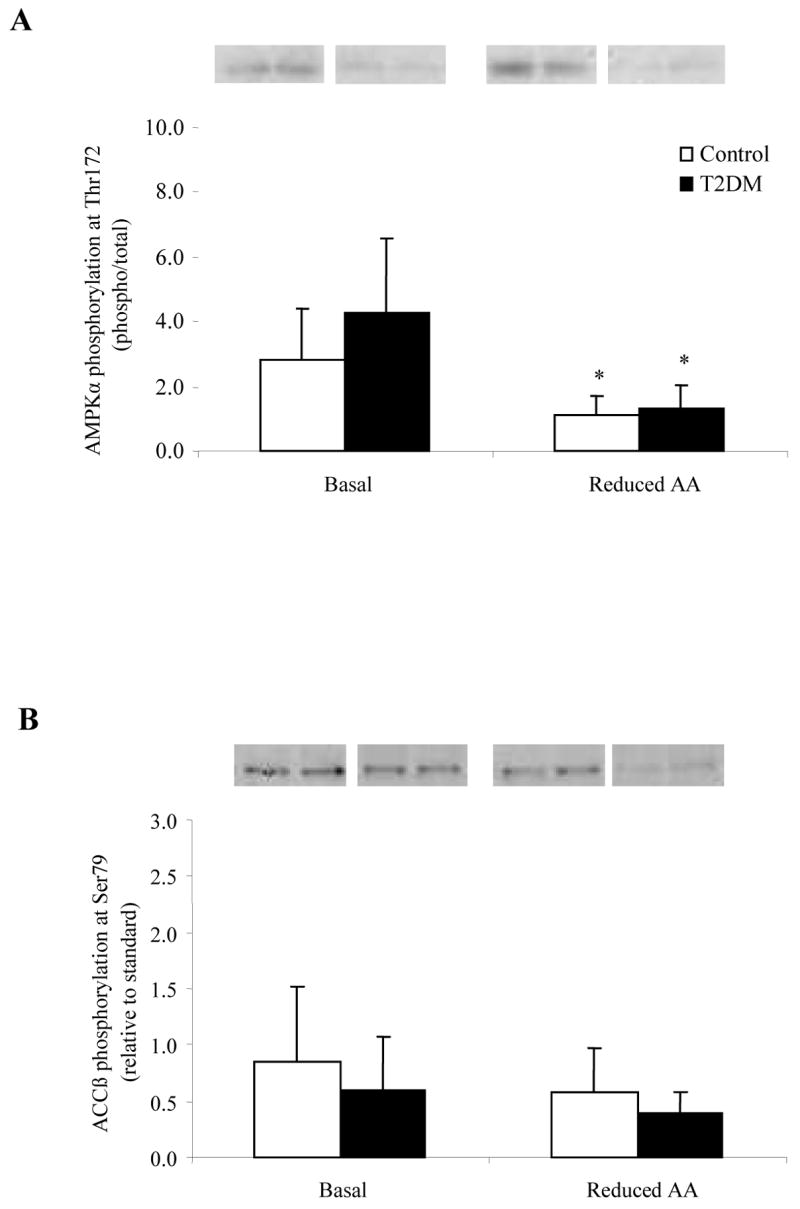
Histograms represent the phosphorylation status of A) AMPKα (n=5) and B) ACCβ at Ser79 (n=5) at Basal and following a Reduced AA clamp in Control and T2DM subjects. Representative immunoblot images are shown above each figure. Phosphorylation values are relative to total protein in Fig. 6A and relative to standard in Fig. 6B. All values are expressed as mean ± SE. *Significantly different than Basal (P<0.05).