
Figure 7.
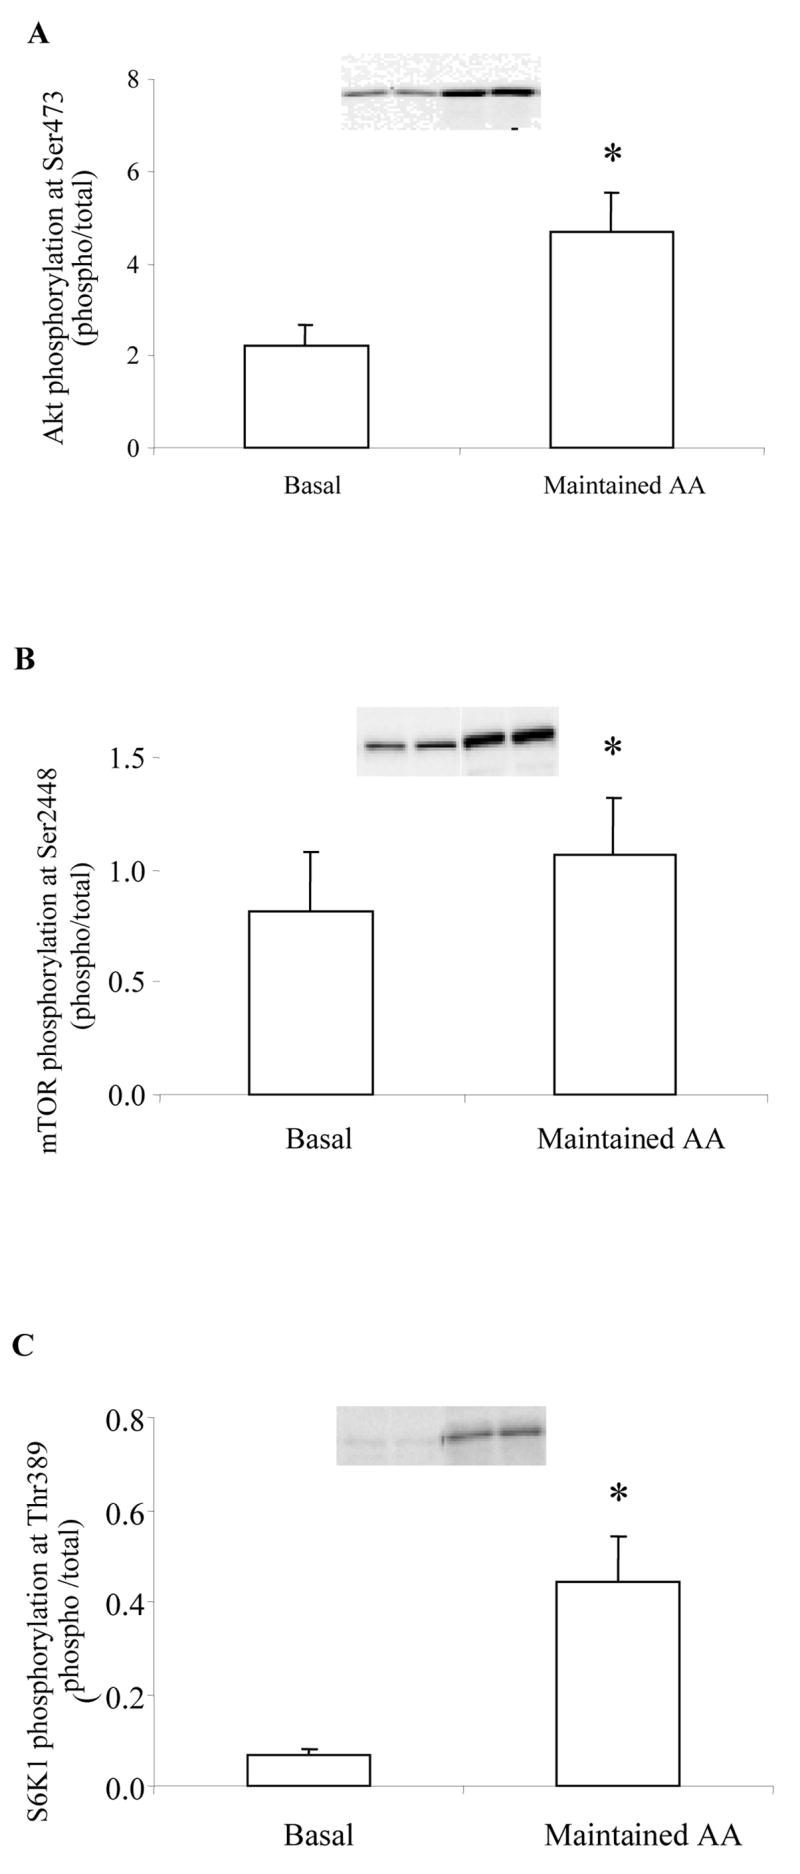
Histograms represent the phosphorylation status of A) Akt at Ser473 (n=4), B) mTOR at Ser2448 (n=4), and C) S6K1 at Thr389 at Basal and following treatment with Maintained AA in young, healthy subjects. Representative immunoblot images are shown above each figure. Phosphorylation values are relative to total protein. All values are expressed as mean ± SE. *Significantly different than Basal (P<0.05).