
FIG. 5.
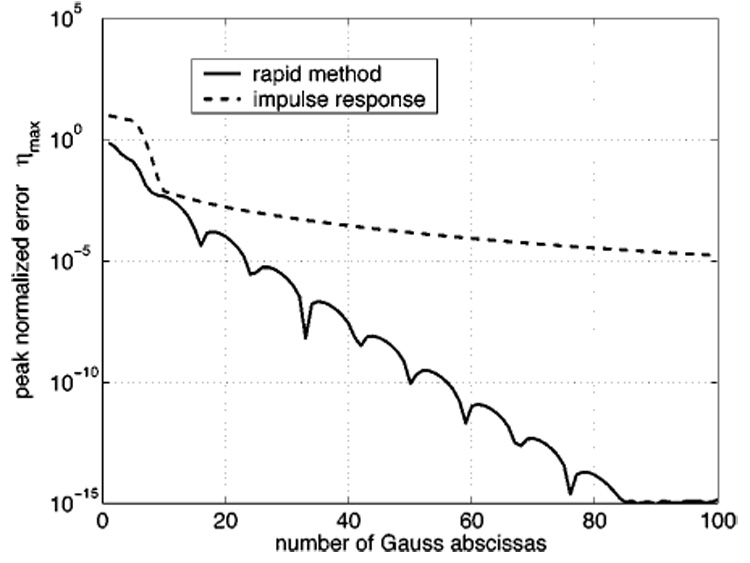
Comparison of the maximum normalized errors ηmax obtained from the rapid approach (solid line) and the impulse response (dashed line) as a function of the number of Gauss abscissas. This figure shows that, for the source and grid geometry evaluated here, the maximum error ηmax computed with the rapid approach is consistently smaller than that obtained with the impulse response. With the rapid formulation in Eq. (6), the computed errors at individual grid locations are also typically smaller than those calculated with the impulse response.