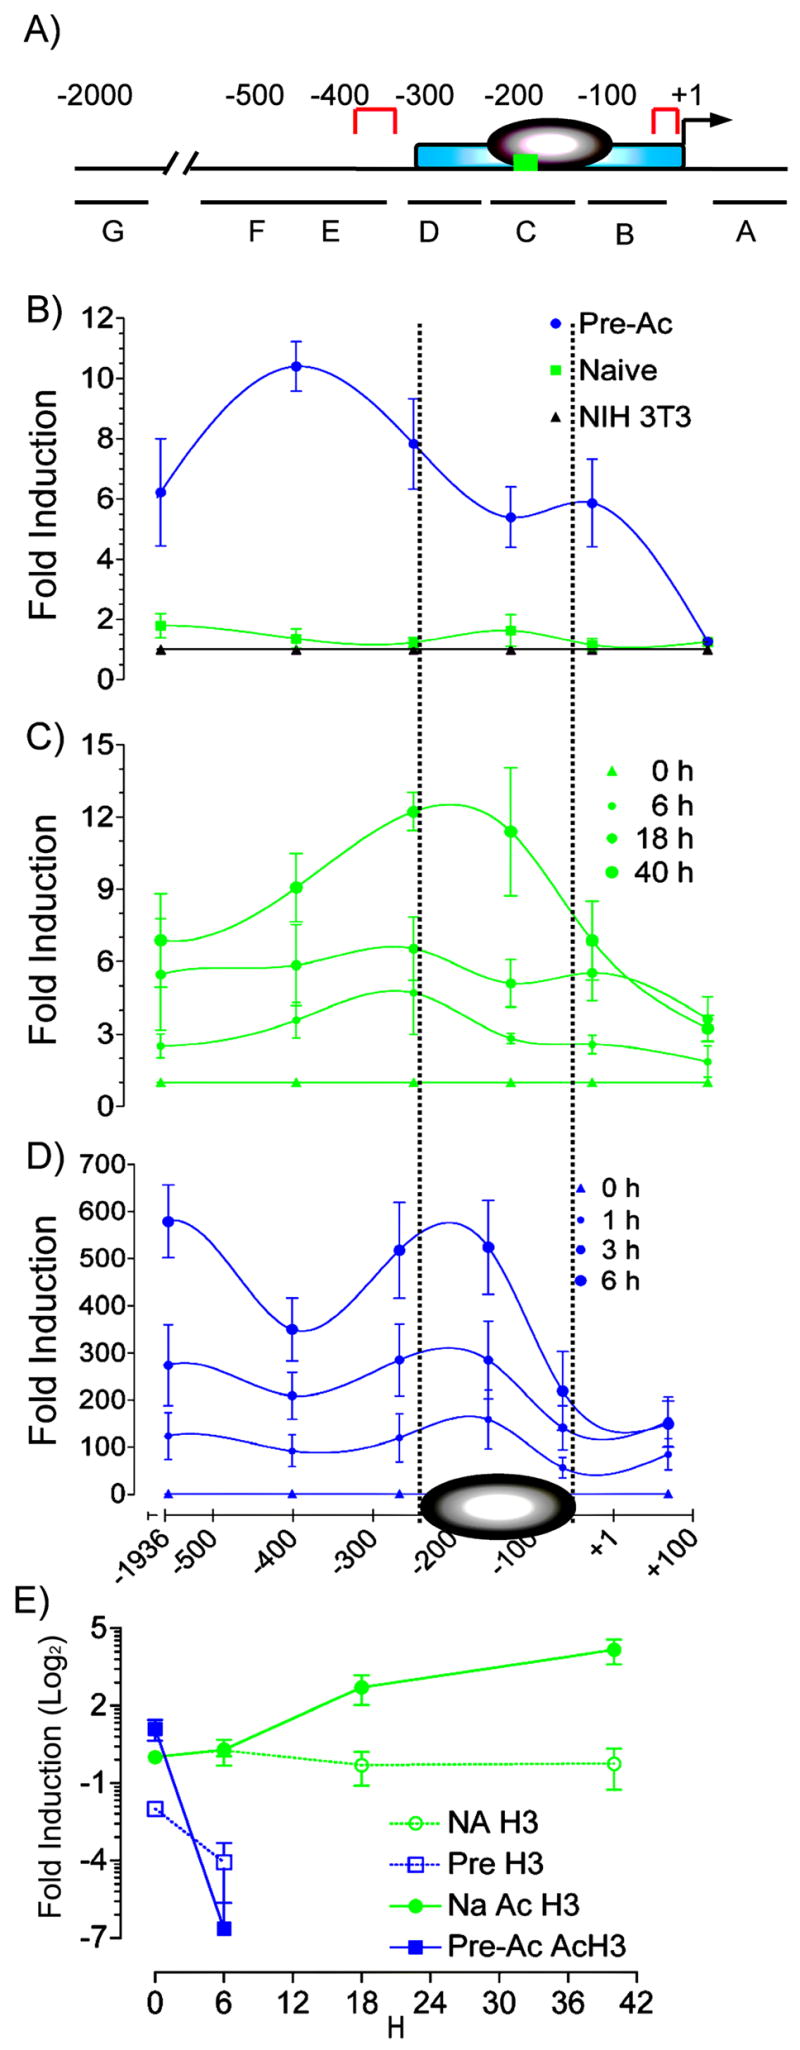
FIGURE 2.

MNase sensitivity at the −300 bp Il2 promoter correlates with the kinetics of Il2 gene transcription. A, The proximal promoter of the mouse Il2 promoter. The minimal essential regulatory region [−300 to +1] (blue), nucleosome [−200 to −60] (gray), hypersensitivity sites in resting cells [−361 to −313 and TATA box] (red) c-Rel κB site [−164 to −152] (green), and the primer sets in the corresponding amplified regions (G = −1982 to −1890; F = −652 to −460; E = −459 to −342; D = −309 to −225; C = −201 to −111; B = −110 to −16; A = +38 to +107) are shown. B, Nuclei were prepared from unstimulated naive (▪) or Pre-Ac (●) WT CD4+ T cells or NIH3T3 fibroblasts (▲) digested with MNase and analyzed using qPCR with seven amplicons across the Il2 gene promoter. The generated Ct values were converted to fold increase relative to undigested genomic DNA using the 2^Ct method. C, Nuclei were isolated from naive CD4+ T cells that were stimulated with α-TCR-β + α-CD28 for 0, 6, 18, or 40 h and analyzed for MNase sensitivity. D, Nuclei were isolated from Pre-Ac CD4+ T cells that were stimulated with α-TCR-β + α-CD28 for 0, 1, 3, or 6 h and analyzed for MNase sensitivity. In both C and D, the generated Ct values for stimulated cells were converted to fold increase relative to respective digested unstimulated controls using the 2Ct method. Means ± SEM are shown. E, ChIP. SYBR® green qPCR and primer set C [−201 to −111] were used to determine total and acetylated histone H3 from sonicated nuclei obtained from naïve and Pre-Ac WT CD4+ T cells following α-TCR-β + α-CD28 for the times indicated. Data are expressed as fold induction relative to unstimulated naïve cells.
