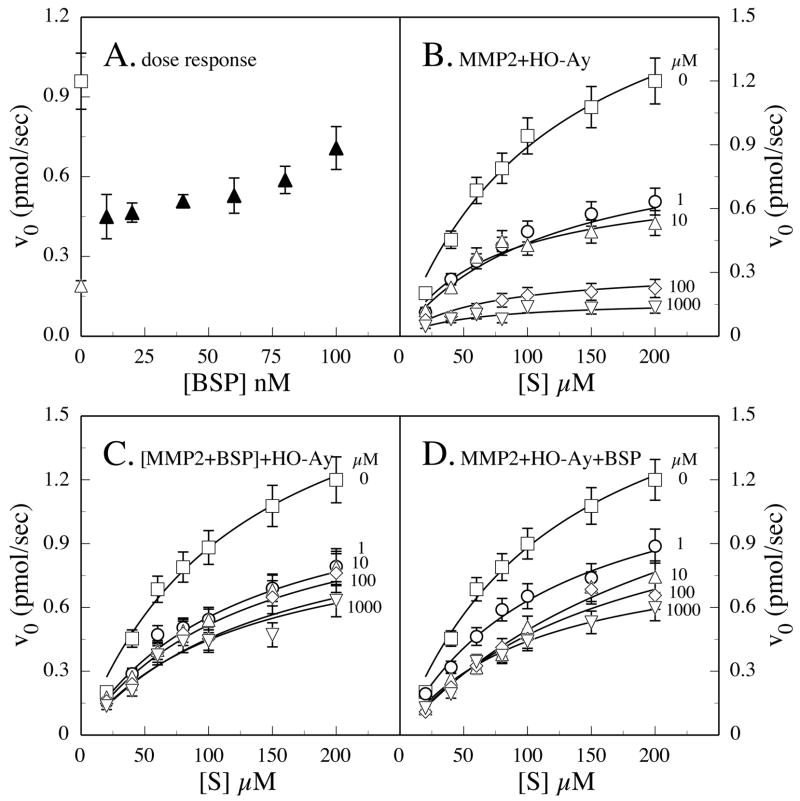
FIGURE 3.
Effects of BSP on oleoyl-N-hydroxylamide (HO-Ay) inhibition of MMP-2. Peptide substrate (100 μM) was incubated with 10 nM MMP-2 (□), 10 nM MMP-2 and 1 nM HO-Ay (▵), or 10 nM MMP-2, 1 nM HO-Ay, and varying concentrations of BSP (▲), and the evolution of product followed by absorbance at 405 nm over the first 6 min of the reaction was used to profile a dose response of BSP restoration of activity (A). Substrate-velocity plots were generated by increasing substrate concentrations at different fixed inhibitor concentrations with the slope over the first 6 min being used to calculate V0 values (B–D). Active MMP-2 was incubated with HO-Ay, whose concentration varied: 0 (□), 1 (○), 10 (▵), 100 (⋄), and 1000 μM (▽). Inhibitor and substrate titrations were made by adding the inhibitor to (B) MMP-2, (C) an MMP-2-BSP preformed complex, or (D) simultaneously added 10 nM MMP-2 and BSP.

