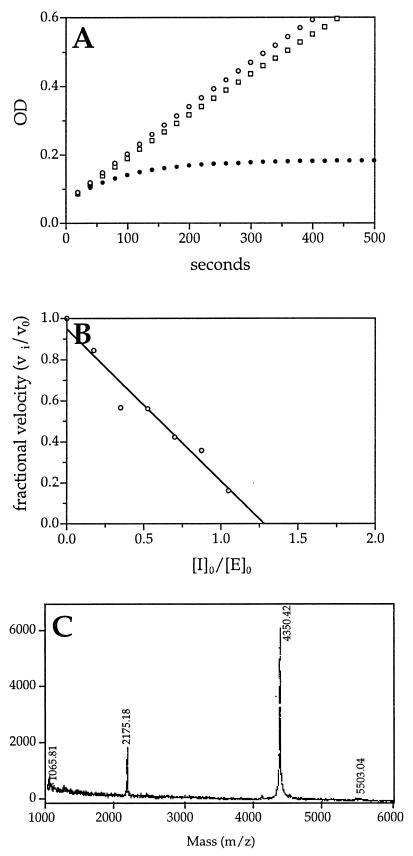
Figure 4.
Kinetic and biochemical analysis of the interaction of trypsin and SCCA1 GlyP2Arg mutant. (A) Kinetic analysis of trypsin inhibition by SCCA1 GlyP2Arg using the progress-curve method. Trypsin (7.7 nM) alone (○) or with SCCA1 (□, 509 nM) or SCCA1 GlyP2Arg (•, 517 nM) was incubated with substrate (EGR-pNA, 0.8 mM) at 25°C in PBS reaction buffer under pseudo-first-order conditions. The progress of trypsin inactivation was followed by measuring the ΔA405 for the reaction over time. The SCCA1 GlyP2Arg mutant inhibited trypsin with a second-order rate constant of kass = 3.9 × 10⁴ M−1⋅s−1. A set of curves from a representative experiment is depicted. (B) Stoichiometry of inhibition of trypsin by SCCA1 GlyP2Arg. Trypsin (4 μM) was incubated with different concentrations of SCCA1 GlyP2Arg (0–4 μM) at 25°C for 30 min in PBS. Residual trypsin activity was measured by adding the substrate (EGR-pNA) and measuring the ΔA405. Fractional activity was the ratio of the velocity of inhibited enzyme (vi) to the velocity of uninhibited control (v0). The stoichiometry of inhibition was determined by using linear regression to extrapolate the inhibitor and enzyme ratio, resulting in complete inhibition. (C) MALDI analysis of trypsin and SCCA1 GlyP2Arg cleavage products. Trypsin (2.2 μg) was incubated with SCCA1 GlyP2Arg (10 μg) for 5 min at 25°C. The reaction mixture then was separated by MALDI MS.

