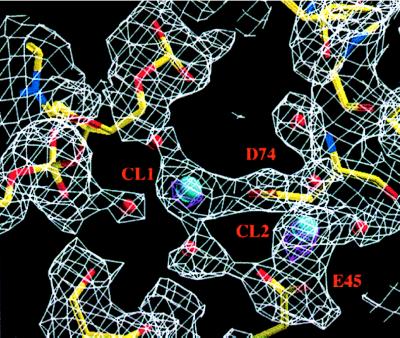
Figure 2.

Simulated annealing omit electron density maps in the active site of subunit I of the EcoRV T93A-DNA-Ca2+ complex. Side chains of Asp-90, Asp-74, Glu-45, Lys-92, and Glu-65 and all solvent molecules, were removed and the resulting model subjected to a simulated annealing refinement protocol in xplor. Electron density maps calculated with coefficients (2Fo − Fc) (white) and (Fo − Fc) (magenta) are shown superimposed on the final model. Phases for these maps were derived from the model with these atoms deleted. Each map was computed in the resolution range from 2.15 Å to 20 Å. The density is contoured at 1.0 σ for the (2Fo − Fc) map and 6.5 σ for the (Fo − Fc) map. Blue spheres represent Ca2+ ions and red spheres represent waters.
