
Figure 3.
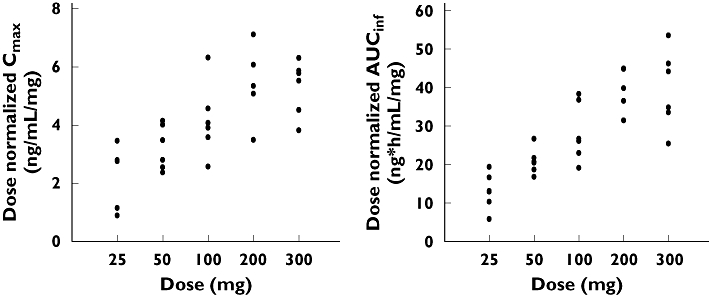
Distribution of dose-normalized Cmax and AUC∞ values following single-dose administration. The values show supraproportional increases with dose (P < 0.0001)
Official websites use .gov
A
.gov website belongs to an official
government organization in the United States.
Secure .gov websites use HTTPS
A lock (
) or https:// means you've safely
connected to the .gov website. Share sensitive
information only on official, secure websites.
Distribution of dose-normalized Cmax and AUC∞ values following single-dose administration. The values show supraproportional increases with dose (P < 0.0001)