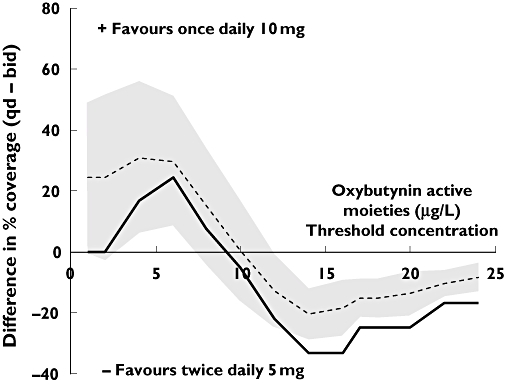
Figure 2.

Mean differences in percentage pharmacokinetic coverage between 10 mg once-daily (q.d.) extended-release oxybutynin, and 5 mg twice-daily (b.i.d.) immediate-release oxybutynin. The solid line represents differences with perfect compliance; broken line represents typical compliance patterns (shaded area is the standard deviation around the mean)
