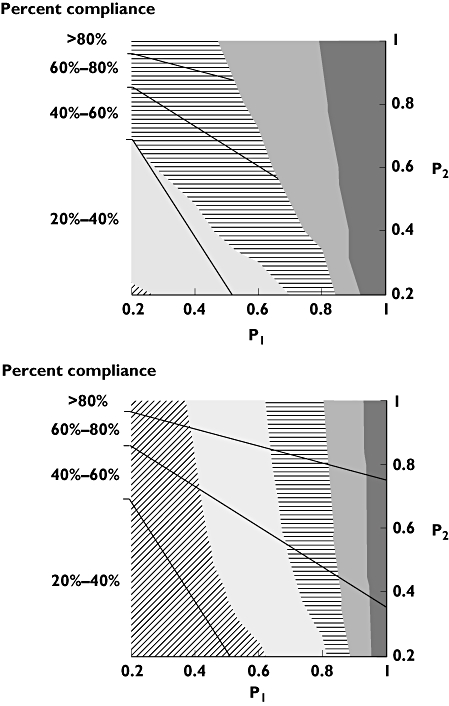
Figure 4.

Two-way sensitivity analyses, illustrating the impact of varying P1 and P2 on the pharmacokinetic coverage of 5 mg twice-daily (upper panel) and oxybutynin 10 mg once-daily oxybutynin (lower panel). Plots are segmented to areas of equal compliance, and the shaded contours highlight different coverage for a given combination of probabilities at a threshold concentration of 10 μg l−1 of active moieties of oxybutynin. 40%–50% (▵); 30%–40% (○); 20%–30% (•); 10%–20% (□); 0%–10% (▪)
