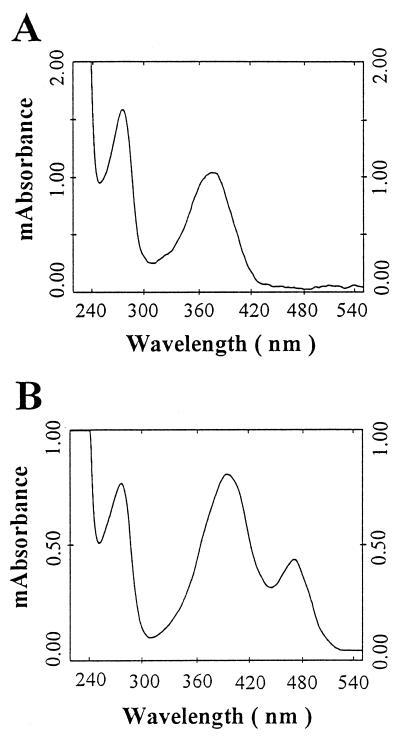
Figure 4.
(A) Absorption spectrum of fraction a from Fig. 3A. The spectrum was measured with the same instrument as in Fig. 3A. mAbsorbance, milli-absorbance unit. (B) Absorption spectrum of rechromatographed first eluting peak from Fig. 3B. The spectrum was measured with the same instrument as in Fig. 3A.

