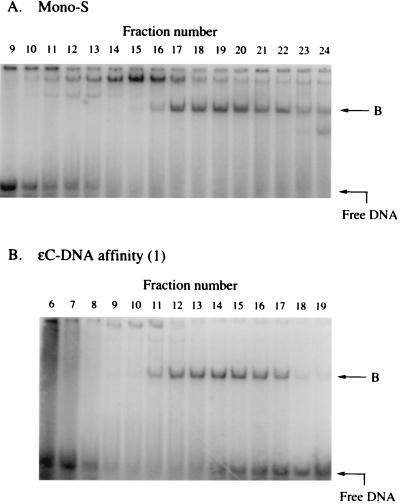
Figure 3.
ɛC binding activity in fractions from Mono-S (Table 1, step V) (A) and ɛC-DNA affinity (1) (Table 1, step VI) (B). Two and one-half microliters of fractions were used to react with 20 fmol ɛC-oligomer (Fig. 1, seq. 1) at room temperature for 30 min in a band-shift assay as described by Rydberg et al. (20). On the right of the gels, B indicates the binding band that correlates with the nicking pattern of the same column fractions (Fig. 5). The unbound DNA also is indicated.

