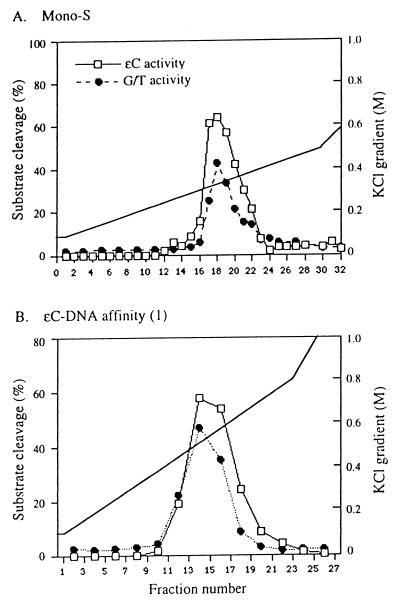
Figure 5.
Coelution of ɛC (—□—) and G/T (—•—) glycosylase activity from Mono-S (Table 1, step V) and ɛC-DNA affinity (1) chromatography (Table 1, step VI). The percentage of cleavage is shown on the left and the gradient on the right. The substrate used for ɛC glycosylase activity is oligonucleotide duplex 1 in Fig. 1 and for the G/T activity the probe is oligonucleotide duplex 4 in Fig 1. The assay conditions are the same as in Fig. 2. Note that assays for the two activities were carried out separately so that the absolute cleavage does not reflect the relative ratio of the two activities.

