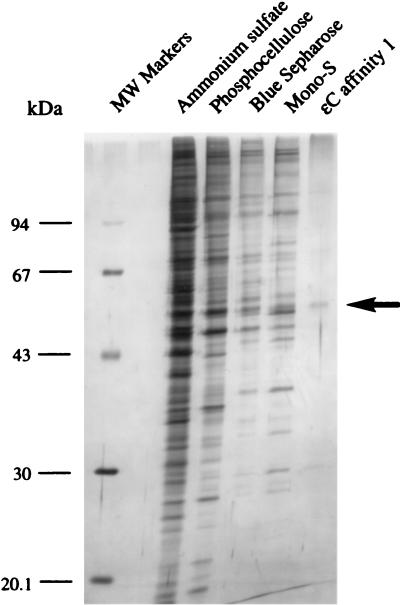
Figure 6.
Silver-stained SDS/PAGE of pooled fractions from purification steps of the HeLa ɛC-DNA glycosylase. On the left are molecular mass markers (BioRad) in kilodaltons, and on the right the arrow indicates the target protein band, which is ≈55-kDa. The gel slice containing this band, after protein elution, denaturation, and renaturation (see Materials and Methods), showed both ɛC and G/T mismatch cleavage activity.

