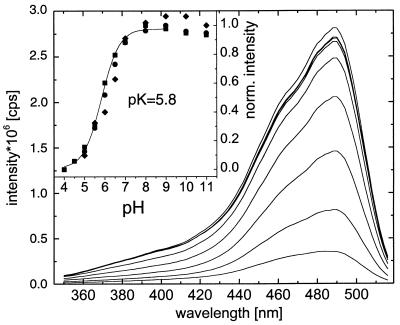
Figure 1.
Fluorescence excitation spectra of EGFP in 100 mM potassium phosphate/10 mM citrate at various pH values (down from the top): 9.0, 8.0, 11.0, 7.0, 6.5, 6.0, 5.5, and 5.0. (Inset) Fluorescence emission intensity at 510 nm (■), fluorescence excitation intensity at 490 nm (•), and absorption at 488 nm (♦) versus pH. The solid line is fit to the emission intensity from pH 4.0 to 9.0 yielding a pKa of 5.8 ± 0.1.

