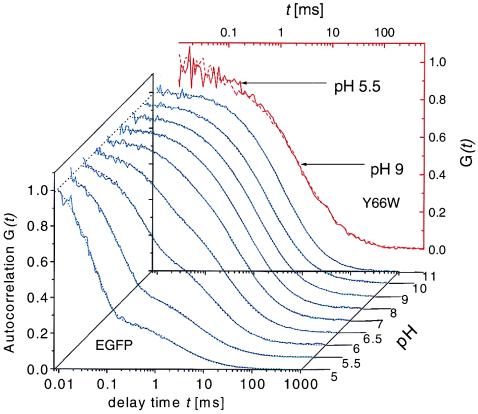
Figure 3.

Autocorrelations G(t) for EGFP (blue curves) at different pH values (normalized to 1 at 10 μs). Fits of Eq. 2 to the data are shown as dotted lines. The decay of G(t) at high pH is dominated by diffusional relaxation, whereas upon decreasing pH, chemical relaxation at shorter time is growing in amplitude and speed. (Inset) Autocorrelations of GFP-Y66W (red curves) at pH 9.0 (solid line) and 5.5 (broken line) showing absence of pH-dependent fast fluorescence flicker in this mutant, which lacks a protonatable hydroxyl on the chromophore.
