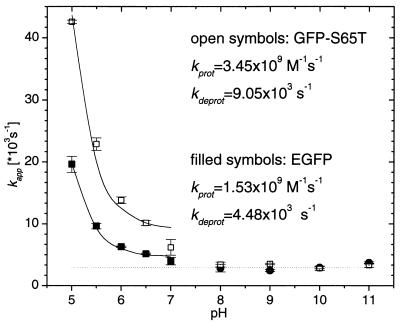
Figure 4.
Results for the apparent rate constants of chemical relaxation as obtained from fits of the correlation curves shown in Fig. 3, using Eq. 2 with the high-pH approximation for pH 8 to 11. For pH 5.0 to 7.0 the values for K′ and τ′C were fixed at the average values obtained from pH 8.0 to 11.0. Open symbols, GFP-S65T; closed symbols, EGFP. Solid lines, fits of the equation kapp = kprot([H+] + [A−]) + kdeprot to the data points from pH 5.0 to 7.0.

