
Figure 3.
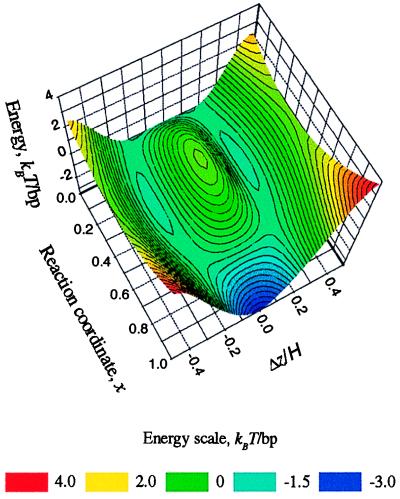
Pair-interaction potential landscape for the B-to-A transition in DNA fibers. Eint(1) in kBT units per base pair (bp) is plotted at a fixed interaxial separation R = 23 Å as a function of the axial alignment (Δz) and of the effective “reaction coordinate” (x) of the transition (x = 0 in the B-form and x = 1 in the A-form). The energy has two minima at Δz/H ≈ ±0.15 in the B form and one minimum at Δz = 0 in the A form. The energy scale is color coded as shown at the bottom. The landscape is symmetric with respect to the Δz = 0 plane. Note that the “reaction trajectory” along the two valleys, most favorable with respect to the electrostatic pair-interaction potential, may differ from the real optimal trajectory because the plotted energy landscape does not include the many-body effects and the internal mechanical energy of the molecules.