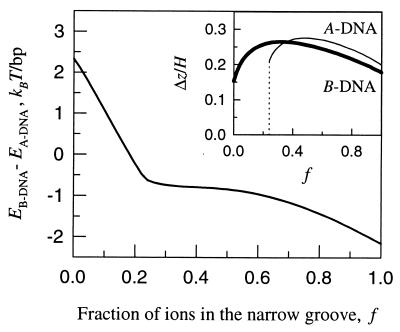
Figure 4.
Effect of counter-ion adsorption pattern on the B-to-A transition. The change in Eint(1) upon the transition is plotted vs. the fraction of ions (f) preferentially adsorbed in the middle of the narrow groove, at R = 23 Å and at the optimal Δz-alignment (f = 0 corresponds to completely random distribution of counter-ions along molecular surfaces). The optimal Δz in each DNA form is plotted in the insert as the function of f. The optimal Δz is a continuous function of f in B-DNA. It exhibits a discontinuous behavior in A-DNA, Δz = 0 at f < f* and Δz/H > 0.1 at f > f*, where f* ≈ 0.24.

