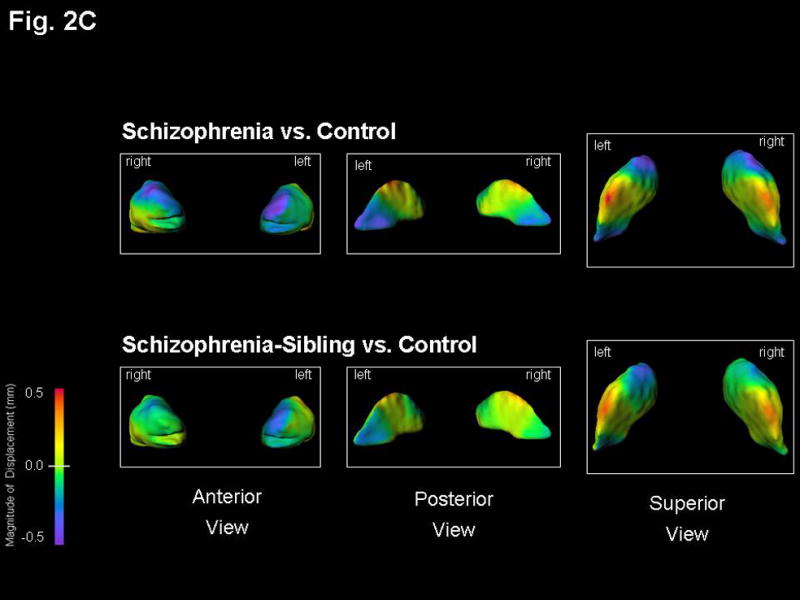
Figure 2. Basal ganglia surface map abnormalities in schizophrenia subjects and their unaffected siblings.


Structures shown are: A) Caudate B) Putamen, and C) Globus Pallidus. Figures represent mean estimated displacement between subject groups, controlling for gender. Surface displacement maps were obtained by first computing for every structure and subject the surface-normal component of the displacement of each surface point of that structure relative to the average surface of all 130 subjects. The least square mean of these displacements for each group (and surface point) was then computed, controlling for gender. Lastly, the difference of these least square means between the two selected subject groups was displayed as a color map (overlaid on the mean surface of the CON subjects).
Purple-to-blue shading denotes regions of inward deformation compared to CON. Red-to-orange shading denotes regions of outward deformation compared to CON. For the SCZ vs. CON maps in the caudate, the largest inward deformation was 0.8 mm bilaterally in its anterior, while for the SCZ-SIB vs. CON maps the inward deformation in this area was 0.6 mm bilaterally. For the SCZ vs. CON maps in the putamen, the inward deformation was 0.7 mm bilaterally in its anterior, while the largest inward deformation was 0.8 mm posteriorly on the left side only. All other maximum deformations were approximately 0.5 mm or smaller, and thus well captured by the indicated color scale. The lateral view of the putamen showed a very similar surface pattern on both left and right sides.
