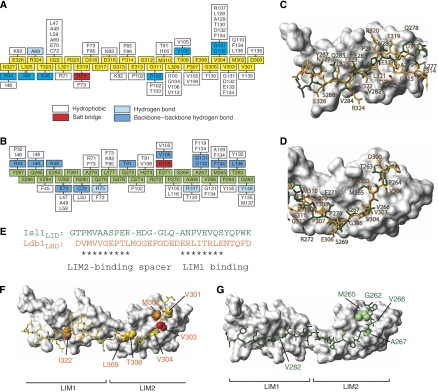
Figure 3.
Comparison of Lhx3-bound Ldb1LID and Isl1LBD. Interaction maps of (A) Lhx3LIM1+2 and Ldb1LID and (B) Lhx3LIM1+2 and Isl1LBD. Residues from Ldb1LID are shown as yellow boxes and those from Isl1LBD as green boxes. Residues from Lhx3 that form contacts with the LIDs are classed as indicated. (C, D) Structural alignment over the backbone atoms of (C) Lhx3LIM1 and (D) Lhx3LIM2 showing the side-chain heavy atoms of Isl1LBD (green) and Ldb1LID (orange). The Lhx3 LIM domains from the Isl1LBD structure are shown as a grey surface. (E) Structure-based sequence alignment of Isl1LBD and Ldb1LID. Asterisks show residues that occupy equivalent positions in the structures. Key Lhx3-binding residues in (F) Ldb1LID and (G) Isl1LBD. Lhx3LIM1+2 in each case is shown as a surface model (grey) with Ldb1LID (yellow) or Isl1LBD (green). For Ldb1LID, the side chains of key residues from alanine scanning mutagenesis screens are classed as having a strong (red), moderate (orange) or weak (yellow) effect, whereas for Isl1LBD the indicated residues (green) all have a strong effect.

