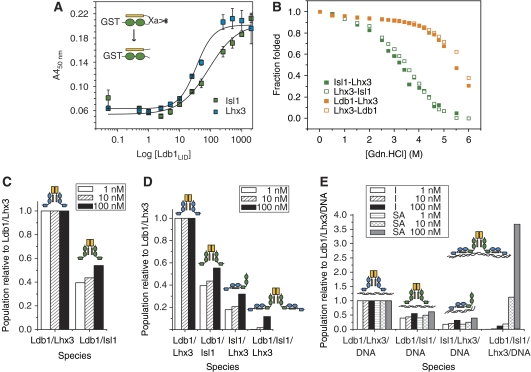
Figure 4.
Binding affinities and modelling of complex formation. (A) ELISAs showing the ability of FLAG-tagged Ldb1LID to bind to the cut Isl1/Ldb1LID and Lhx3/Ldb1LID complexes. Data were corrected for background binding to GST, and the error bars show the range of values obtained from triplicates of a single experiment. The inset shows a schematic of tethered intramolecular constructs of the Isl1–Ldb1LID, where the linker contains a Factor Xa protease site. After treatment with Factor Xa, the linker is cut to form an intermolecular complex. (B) GdnHCl denaturation curves for Lhx3–Ldb1LID and Lhx3–Isl1LBD constructs as indicated. (C–E) Trends for the formation of protein and protein:DNA complexes containing Ldb1, Lhx3 and Isl1. Concentrations of all components were set at 1, 10 and 100 nM. (C) Distribution of Ldb1/LIM-HD complexes using the binary model (no interaction between Isl1 and Lhx3, and no DNA). (D) Distribution of protein-only complexes using the ternary model, which also considers binding of Isl1 and Lhx3. (E) Distribution of key protein:DNA complexes relative to Ldb1/Lhx3/DNA. The I series shows the results of using the independent model, the SA series shows the results of the single-molecule DNA-binding advantage model where the binding of two and four HDs to a single molecule of DNA shows increased binding affinities over single HD binding.

