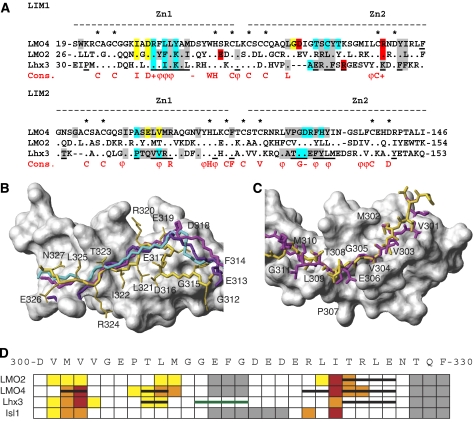
Figure 5.
Comparison of LIM–Ldb1LID complexes. (A) Structure-based sequence alignment of the LIM1 domains from murine LMO2, LMO4 and Lhx3 (Lhx3b numbering is used although the LIM domains are the same in different splice variants of Lhx3). Dots show conserved residues, dashes indicate gaps in the alignment and zinc-ligating residues are indicated by an asterisk. A consensus sequence for LIM domains from LIM-HD and LMO proteins from Deane et al (2004) is also shown. Fully conserved residues are indicated as capitals, + indicates R or K, − indicates D or E, and ϕ indicates bulky hydrophobic residues. Residues that are conserved at the interface of LIM–Ldb1LID interactions are shaded (grey—hydrophobic; blue—backbone–backbone hydrogen bonds; yellow—other hydrogen bonds; red—electrostatic; many residues coloured blue, yellow or red also make hydrophobic interactions). Underlined residues in Lhx3 are at the interface of the Lhx3/Isl1LBD complex. (B, C) Ldb1LID from complexes containing LMO2 (1J2O, cyan), LMO4 (1M3V, violet; IRUT, magenta) and Lhx3 (yellow) shown in relation to the LIM domains from Lhx3 (grey surface representation) structures are overlaid over the backbone atoms of the LIM domains. (B) LIM1 domains/C-terminal half of Ldb1LID as backbone traces. (C) LIM2 domains/side-chain heavy atoms of the N-terminal half of Ldb1LID. (D) Summary of alanine mutagenic screening of Ldb1LID against LMO2, LMO4, Lhx3 and Isl1. The sequence of Ldb1LID is shown at the top; coloured boxes indicate a weak (yellow), moderate (orange) and strong (red) effect on binding when residues were individually mutated to alanine. Grey boxes indicate no differences. Where structures have been determined (LMO2LIM1, LMO4, Lhx3), β-strands formed in Ldb1LID are shown as black bars. The spacer region from the Lhx3–Ldb1LID complex is shown as a green bar.

