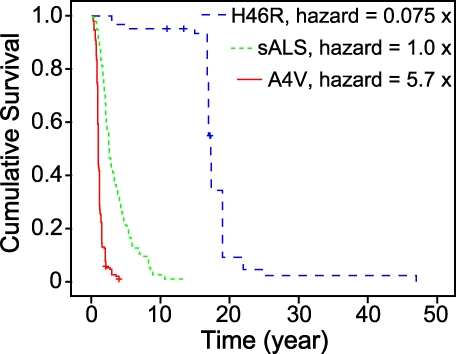
Figure 1. fALS Patients' Kaplan–Meier Survival Curves Illustrating Low and High Risk SOD1 Mutations.
Kaplan–Meier survival curves from patients with A4V (red) and H46R (blue) SOD1 mutations and sALS (green) are as shown. Disease durations from 205 patients with A4V SOD1 mutation, 63 patients with H46R SOD1 mutation, and 269 patients with sALS were used to generate these Kaplan–Meier survival curves.

