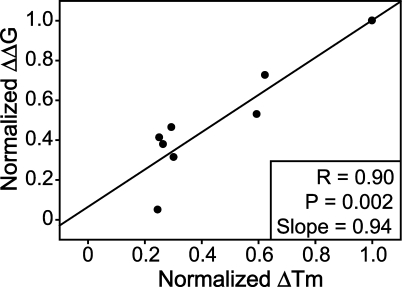
Figure 5. Correlation between Measures of Stability, Specifically Normalized ΔT m and ΔΔG, Reported from Different Groups for Apo SOD1 Variants.
The variants with both measured ΔT m and ΔΔG were plotted, and a good correlation between normalized ΔT m and normalized ΔΔG was observed. This correlation provides the rationale for averaging ΔT m and ΔΔG and taking the average value as an indicator for stability of fALS-related variants. The normalized ΔT m and ΔΔG were obtained as described in the Materials and Methods section.

