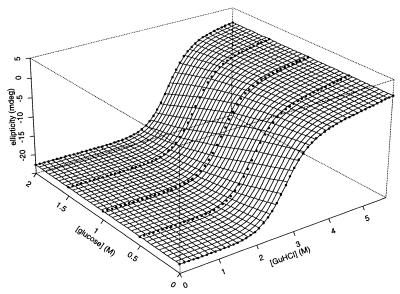
Figure 1.
The equilibrium unfolding of protein L as a function of glucose and GuHCl. The circles denote the far UV (220 nm) CD signal of protein L at various cosolvent concentrations. The surface represents a fit to a model assuming a simple, linear relationship between the relative free energy of folding and the concentration of each cosolvent (see Eq. 2 in the text). The quality of this fit (r2 = 0.98) is significant evidence that, over these concentration ranges, the effects of GuHCl and glucose on protein L stability are both linear and additive. Conditions are 50 mM phosphate buffer (pH 7.0) at 22.5°C.

