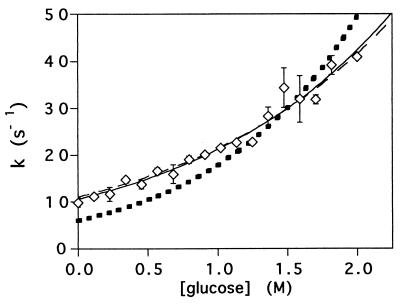
Figure 5.
The refolding rates of protein L at 0.636 M GuHCl and a range of glucose concentrations are well fitted by a simple kinetic model (solid line; r2 = 0.97) assuming an inversely proportional relationship to solvent viscosity and a linear relationship between the free energy barrier and glucose concentration. The predicted kinetic mfS value thus obtained (1.3 ± 0.1 M−1) is very similar to the value (1.2 M−1) obtained independently by assuming the true θ value is the viscosity-corrected θglucose value (see text). Fixing mfS at 1.2 M−1 (see text for justification) and introducing an internal friction term, ξ, to the model produces an equivalently good fit (dashed line; r2 = 0.97) and predicts an insignificant internal friction (−0.1 ± 0.2 cP). Fixing mfS at 1.2 M−1 and fixing the internal friction at 4 cP [the internal friction observed for a conformational change in myoglobin; (32)] produces a significantly poorer fit (dotted line; r2 = 0.79). See text for a full description of the various kinetic models.

