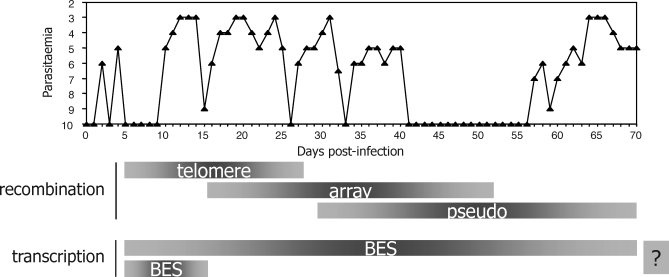
Figure 1. VSG Switching Hierarchy in T. brucei.
The graph is adapted from [9] and shows the numbers of T. brucei cells (parasitaemia) measured in a cow for up to 70 days post-infection (this measurement is depicted by inversely plotting the prepatent period, in days, that a 0.2-ml inoculum of cattle blood achieves a parasitaemia of 1 × 108.1 trypanosomes ml−1 units in an immunosuppressed mouse). Below the graph is a depiction of VSG gene activation timing (see Figure 2 for details of the switch mechanisms). During VSG switches driven by recombination, silent VSGs at a telomere are, in general, activated more frequently that subtelomeric array VSGs, which are activated more frequently than VSG pseudogenes (pseudo). It is unclear (indicated by a question mark) if transcriptional switches between VSG bloodstream expression sites (BES) occur predominantly at the start of an infection or continue throughout.

