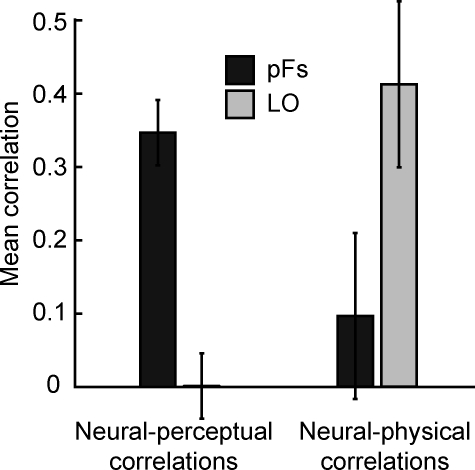
Figure 2. Mean Correlations across Participants between Neural and Perceptual Similarities (Left) and Neural and Physical Similarities (Right).
Neural-perceptual correlations are high in pFs and low in LO, and the reverse is true for neural-physical correlations. Shown are means ± 1 (conventional) standard error (SE).

