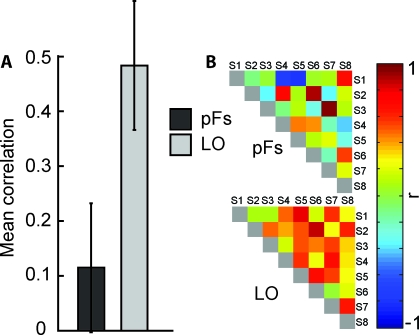
Figure 3. Inter-Participant Reliability.
(A) Mean neural inter-particiapnt correlation coefficients in pFs (left) and LO (right). Consistent with observer-specific, subjective similarities in pFs, and physically-based similarities in LO, inter-participant reliability is low in pFs and high in LO. Shown are means ± 1 (conventional) SE.
(B) Neural inter-particiapnt reliability in pFs (top) and LO (bottom). Each cell represents the correlation coefficient between the neural similarity matrices of two individual participants. A high correlation indicates that pairs of stimuli that are neurally similar in one participant are also neurally similar in the other participant.

