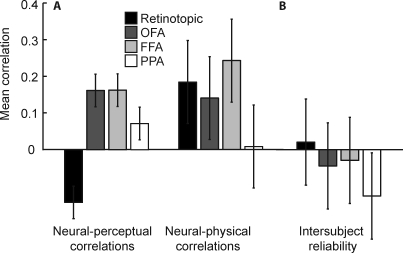
Figure 4. Correlations in Control ROIs.
(A) Mean correlations across participants between neural and perceptual similarities (left) and neural and physical similarities (right) in control ROIs. No bar is significantly different from zero using Fisher-z–transformed correlations and standard errors. Shown are means ± 1 (conventional) SE.
(B) Neural inter-participant reliability in control ROIs. Each bar represents the average correlation coefficient between the neural similarity matrices of all pairs of individual participants. A high correlation indicates that pairs of stimuli that are neurally similar in one participant are also neurally similar in the other participant. No bar is significantly different from zero. Shown are means ± 1 (conventional) SE.

