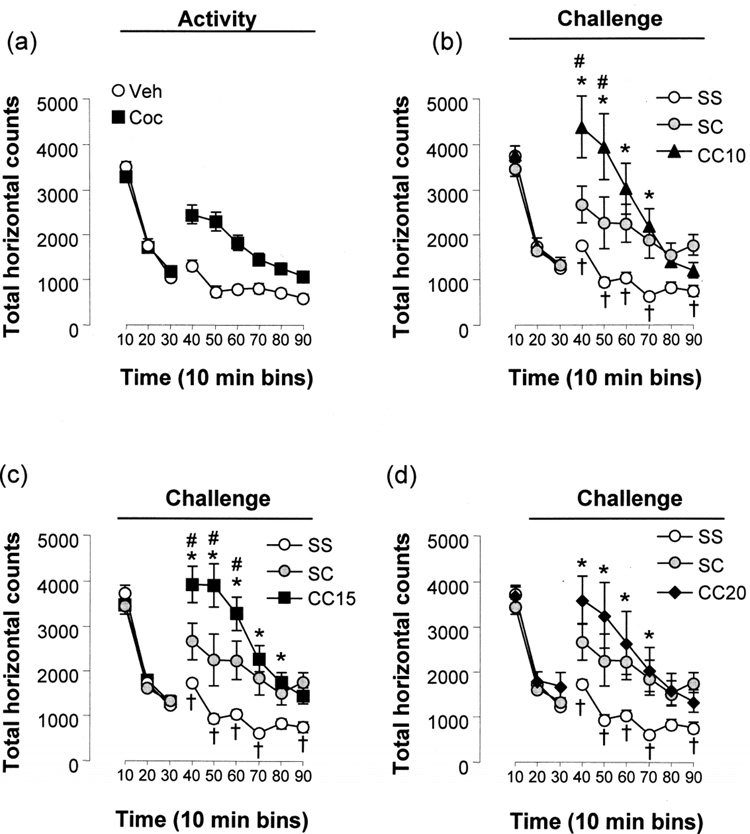
Figure 3. Locomotor sensitization to cocaine following repeated administration.
Graphs illustrate the total horizontal counts 30 min prior to and 60 min after an i.p. injection of 10 mg/kg cocaine or saline in 10 min bins. Panel (a) depicts total horizontal counts before and following i.p. injection on the activity day. n= 29 (Veh), n= 42 (Coc). Panels (b–d) depict total horizontal counts before and following i.p. injection on the challenge day. Eleven of the saline-conditioned group received cocaine instead of saline (grey circles). The total horizontal counts for the (b) 10 mg/kg, (c) 15 mg/kg and (d) 20 mg/kg cocaine-conditioned groups are shown with respect to the saline-conditioned group. Significant differences by Holm-Sidak post-hoc test (p<0.05) are indicated by an asterisk (SS vs. CC), by a hash (SC vs. CC), by a cross (SS vs. SC) and by a dollar sign (activity day vs. challenge day). n=18 (SS), n=11 (SC), n=8 (CC10), n=24 (CC15) and n=10 (CC20).

