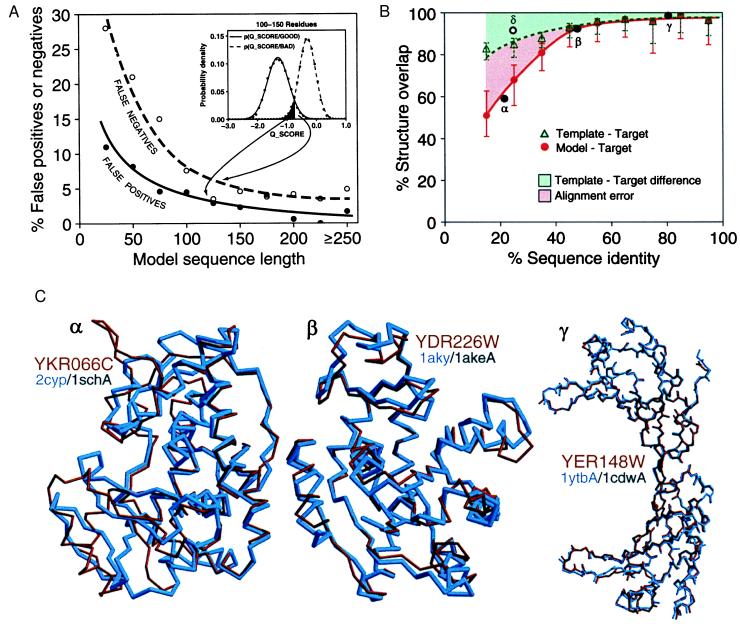
Figure 1.

Predicting the overall accuracy of comparative models. The good and bad models for proteins of known structure are used to tune the prediction of reliability of a model when the actual structure is not known (Fig. 2). See Materials and Methods for details. (A) A rule for assigning a comparative model into either the good or bad class, based on its Q_SCORE. Inset shows the distributions of Q_SCORE for the good and bad models with 100 to 150 residues. Such distributions are used with the Bayes theorem to calculate the posterior probability that a model is good, given that it has a certain Q_SCORE value, p(GOOD/Q_SCORE). The main plot shows the percentages of false positives (bad models classified as good) and false negatives (good models classified as bad) as a function of sequence length. The curves were obtained by the jack-knife procedure. (B) A rule for estimating the accuracy of a reliable model (as predicted by its Q_SCORE), based on the percentage sequence identity to the template. The overlaps of an experimentally determined protein structure with its model (red continuous line) and with a template on which the model was based (green dashed line) are shown as a function of the target–template sequence identity. This identity was calculated from the modeling alignment. The structure overlap is defined as the fraction of the equivalent Cα atoms. For comparison of the model with the actual structure (filled circles), two Cα atoms were considered equivalent if they were within 3.5 Å of each other and belonged to the same residue. For comparison of the template structure with the actual target structure (open circles), two Cα atoms were considered equivalent if they were within 3.5 Å after alignment and rigid-body superposition by the align3d command in modeller (15). The points correspond to the median values, and the error bars in the positive and negative directions correspond to the average positive and negative differences from the median, respectively. Points labeled α, β, and γ correspond to the models in (C). The empty circle at 25% sequence identity corresponds to the unusually accurate model in Fig. 3B. (C) The range of accuracy for reliable comparative models is illustrated by a difficult, medium, and easy case. The Cα backbones of the models (red) for YKR066C and YDR226W and all mainchain atoms for YER148W are superposed with those of the actual structures (blue). The PDB codes of the target and template structures also are shown (target/template). The three target–template sequence identities are indicated in B (black filled circles). The number of yeast ORF models at each accuracy level can be determined from the red curve in B, or the sample comparisons in C, combined with Fig. 2A.
