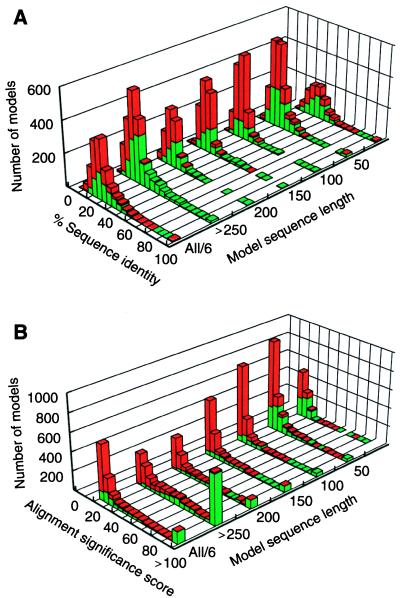
Figure 2.

Protein structure models for yeast ORFs. (A) Distribution of the sequence identity between the models and the corresponding templates as a function of model sequence length. The 3,992 reliable models for substantial segments of 1,071 different ORFs that are predicted to be based on a correct template and approximately correct alignment are represented by the green bars, and the 4,588 unreliable models that are predicted to be based on a mostly incorrect alignment or an incorrect template are represented by the red bars. The last histogram at label “All/6” is the sum of the other six histograms divided by six. (B) The corresponding distribution of the alignment significance score calculated by the program align (13).
